Ferry Logo

Ferry Logo

Thursday, 29 January 2015

Connecting Buses and Ferries

Achieving reliable bus and ferry connections can be a challenge, but it pays off handsomely when they work well.

There are examples in the Sydney Ferry network of both good and bad connections.

Cremorne Point on the Mosman line generally works well. The off peak frequency of both the ferry and connecting 225 bus line is 30 minutes. The 225 bus terminates at  Cremorne Point with a 13 minute layover. It arrives five minutes before the inbound ferry to Circular Quay departs at :05 and :35 past the hour. It leaves three minutes after the outbound ferry is due to arrive from Circular Quay at :10 and :40 past the hour. This allows one bus to connect with both the inbound and outbound ferry.  

Because the 225 bus line is generally reliable, with just a short section of its route on a congested main road, the bus is well patronised with transfers from the ferry.

It is also a highly legible transfer, because every bus you catch in the direction of the wharf connects with the ferry. And every ferry arriving at Cremorne Point connects with the bus. 

Simplicity and reliability make effective connections.

A connection point that does not work well is Balmain East. On first blush, you might expect it would. On week-days, the ferry operates at 30 minute intervals all day. The ferry outbound from Circular Quay departs Balmain East just two minutes before the inbound ferry. This means one bus should be able to can connect with both ferries.

But the connections are neither reliable nor legible.

To appreciate the problem, some understanding is needed of the Balmain peninsula. By Sydney standards, it is densely populated with two main transport corridors:
  • Darling Street, which runs from the ferry wharf at the eastern end to Victoria Road at the western end.
  • A second corridor runs from Birchgrove in the northern corner to the intersection of Robert Street and Victoria Road in the south.
The two corridors cross at the Balmain shops, adjacent to the Post Office.

 
Four main bus lines operate on these corridors (there are actually more but I won't complicate the story more than I have to), all at 20 minute intervals on week-days off-peak:
  • 445 bus runs the length of Darling Street from Balmain East, continues across Victoria Road and terminates eventually at Campsie in Sydney's south west.
  • 442 bus also starts at the ferry wharf, but turns south at the Post Office towards Mullens Street before crossing the ANZAC Bridge and terminating in the Sydney CBD.
  • 441 bus starts at Birchgrove and runs south, also following Mullens Street down to the ANZAC Bridge and terminates in the CBD.  
  • 433 bus starts part way along Darling Street at Gladstone Park. It follows Darling Street to Victoria Road, where it turns south, then west along the A4 before turning off to Glebe and finally the CBD.
In addition to these four lines, numerous buses operate at high frequency on Victoria Road.

The line structure is complex. It's complex because it suffers from what could be described as the "Australian disease" - an habitual preference for avoiding transfers in the bus network, especially for CBD commuters.
 
Despite the number of buses operating, the connections to the ferry do not work well:
  • all the bus lines can be subject to traffic delays, so reliability is poor. 
  • a 20 minute bus interval does not mesh well with a 30 minute ferry interval. If a transferring ferry passenger wants to travel to Rozelle in the western end of the peninsula, only every second service connects with the appropriate bus (445).
There is a simple way to fix this problem, without increasing capacity. There should only be two bus lines on the Balmain peninsula - the 441 and 445 - but operating at a minimum of 10 minute intervals all day. That's twice the current off peak frequency.

Passengers on the 445 line east of Balmain shops who need to go to the CBD can transfer to the 441 bus where the lines intersect adjacent to Balmain Post Office. Those who need to go to Glebe can take the 445 and transfer at Lilyfield for a Glebe bus.
 

As both lines have minimum headways of 10 minutes (and could be five minutes in the peaks), waiting time at the transfer point at Balmain shops is short.

And passengers who disembark from the ferry have only a short wait for the connecting bus, with consistent access to anywhere on the Balmain peninsula.
 
The good news is that fixing the ferry/ bus connections can also lead to a high frequency/ more legible timetable for all bus users, not just those transferring from a ferry. 

Thursday, 22 January 2015

A Swiss Perspective on Regular Interval Timetables

Source: Tzieropoulos, Emery and Buri (2010) Regular-interval timetables: theoretical foundations and policy implications
If anyone wants to read a good overview of the Swiss approach to timetabling, a paper presented at the World Conference on Transport Research in 2010 "Regular-interval timetables: theoretical foundations and policy implications" is a good place to start.
https://drive.google.com/file/d/0B8oNGOYNGBBwSTJPelNGV2dvV2s/view?usp=sharing
Co-authored by Panos Tzieropoulos, Daniel Emery and Jean-Daniel Buri, it describes what a regular interval timetable is and how passengers benefit, operations are simplified and safety is improved.

The paper also highlights some important differences between traditional approaches to transport planning and the Swiss way:
  • rather than attempting to tailor transport supply to demand at an individual service level, the Swiss approach is to offer a consistent and balanced supply across the day. This conveys a message to passengers that "public transport is there and available at any time, much like the private car".
  • Swiss transport planning starts with service planning, from which infrastructure and rolling stock (or vehicle/ vessel) needs are determined.
The level of detail in service planning would surprise an Australian audience. Detailed timetables are developed 20 years in advance. Service planning takes place first because the timetable is viewed as being centrally important to the customer. And as there is little flexibility around the rules for creating regular interval timetables, it is easier to make the infrastructure fit the timetable than the other way round.   

Thursday, 15 January 2015

The Inexact Science of Fair Fare Determinations

Sydney's public transport has long resisted world trends by maintaining a fare structure which differentiates between modes.

Ferry travellers, for example, pay more per kilometre travelled than either bus or train passengers. In some cases the differences are staggering. The 1.2 km ferry ride from Balmain East to Darling Harbour attracts a full adult Opal fare of $5.74. As a comparison, the Opal adult off peak train fare from Newcastle (Hamilton) to Sydney (Central), a distance of 165 km, is $5.81. 

Even on peak services, the fare per km travelled to Newcastle by train is about one hundredth of the fare paid by Balmain East ferry commuters.      

The introduction of the Opal card has extended the modal differentiation:
  • Opal users who transfer between services on the same mode do not pay extra, but if the transfer is made between modes, a separate fare is charged.
  • since August 2014, "go anywhere" monthly, quarterly and annual travel passes are no longer available.
  • the remaining weekly MyMulti ticket zone rules are applied differently across modes. Someone travelling from Manly to Sydney can use the cheaper MyMulti 1 ticket on a bus but must use a MyMulti 3 if taking the ferry.    
A common justification for fare "modism" is that it is fairer. Why should bus travellers, for example, pay the same fare as passengers on a more costly ferry trip?

So what is the difference in operating cost per passenger journey of ferries, trains and buses? According to the NSW Auditor General, rail services were the most expensive at $13.28 in 2014, followed by ferries ($9.27) and buses, which were the cheapest ($7.46).

But a more meaningful way of looking at this is to compare cost per passenger km. The average distance travelled varies between modes, so this tells a slightly different story.

(1) Source: NSW Auditor General's Report Financial Audit Volume 7 2014 (p.17)
(2) Train and bus average distance sourced from BTS Household Travel Survey 2012-13. Ferry average distance estimated from data supplied by BTS from November 2013 Ferry Census.
(3) The Auditor General's Report does not provide details of what costs are included in its analysis. The assumption made here is that the comparisons are like with like.
As the average train journey is more than twice the length of average bus trips, train operating costs are more favourable, 31 cents per km less than buses.

Average ferry trips are also longer than the bus average, which means buses are just eight cents cheaper to run per passenger km than ferries.

There are also modal differences in the directness of journeys. Trains offer the most direct point to point journeys, but ferries are also far more direct than buses. The 1.2 km ferry ride from Balmain East to Darling Harbour, for example, compares favourably with the alternative, tortuous 6.5 km bus journey. 

No comprehensive data is available to compare bus and ferry journey distances as the crow flies, but it is not unreasonable to conclude that, if this was done, the operating cost of ferries per passenger km is actually less than buses if journey distance is measured directly, point to point.

The agency responsible for reviewing transport fares in NSW is the Independent Pricing and Regulatory Tribunal (IPART). In making its fare determinations, IPART acknowledges that fare subsidies can be justified because public transport has external benefits enjoyed by non users. These include reduced road congestion and less air pollution. From time to time, IPART attempts to measure these external benefits by mode, which later feed into its fare determinations.

To put the best possible spin on this, a careful reading of IPART reports reveals that measurement of external benefits must be an inexact science, if it is a science at all.

In August 2014, IPART published an issues paper "Estimating the External Benefits of Public Transport Used in Setting Maximum Fares for Rail, Bus and Ferry Services". Based on IPART's current model, the paper estimates the external benefits of ferries are tiny compared to other modes:

Source: IPART Issues Paper Estimating the External Benefits of Public Transport (table 3.1), August 2014
The limited external benefits of ferries were due to a combination of reasons, including higher air pollution and IPART's belief that passengers have the option in most cases of using a lower cost bus service as an alternative to ferry travel.  

Later in 2014, IPART released another report, revising its methodology and assumptions about what to include as external benefits.  One change was to "focus on estimating the external benefits associated with an extra passenger using an existing service". The previous method assumed services (and therefore costs) increase in proportion to patronage growth.

Another change was to widen the external benefits measured, including reduced road accidents and improved health outcomes.

The revised method made surprising changes to the estimate of external benefits by mode:

Source: IPART Report: Review of External Benefits of Public Transport, Table 1.1 p.8 (December 2014)
The new report provides the estimates as a range of possible values. In the case of ferries the range is very large: between one and 21 cents per passenger journey. As students of statistics will know, when there is a range of possible values like this, the mean is not more likely to be the true value than any other value in the range. So the external benefit per passenger km for ferries, according to IPART, could be one cent or 21 cents, or anywhere in between.

These figures suggest that the external benefits of ferries could be twice as high as buses and trains or they could be as little as one twentieth. IPART is not sure.

To further complicate matters, the range of possible external benefits used by IPART in its models, continue to be very limited. Suggestions by stakeholders for including other things, such as improved mobility and social inclusion, are dismissed in the report, partly because they are too difficult to measure.

This points to ontological flaws in IPART's analysis, a weakness not uncommon in other economic studies. Something that cannot be measured is no less real than something else that can. 

Read together, the Auditor General's Report and the latest IPART report point to the following conclusions about ferry fares:
  • the operating cost per passenger km of buses and ferries are similar. Ferry costs would be less than bus costs if journey distances were measured direct, point to point.
  • the measurement of external benefits of public transport travel is highly subjective and the estimated ranges provided by IPART are so wide that it is not possible to determine whether ferries offer a higher or lower benefit than buses or trains.
The solution lies in learning from European countries where public transport fares do not distinguish between modes. These countries build highly legible, integrated public transport systems with heavily discounted periodical multi modal tickets. This leads to high rates of public transport use, highly mobile and liveable city environments and high cost recovery, in most cases more than double the rate achieved in NSW.  

A fresh approach to fare structures in Sydney is long overdue.  

Wednesday, 24 December 2014

Balmain East - are too many berthings barely enough, or are they just too many?

Plans for the new ferry terminal at Barangaroo include a big rise in ferry frequencies on the Darling Harbour (F4)Line. Week-day AM peak departures from Barangaroo will increase from two per hour to six per hour in 2016. Week-end peak departures will increase from three per hour to eight per hour.
 
The Barangaroo terminal can probably manage 7.5 minute headways for the Darling Harbour Line. But what are the implications for other Darling Harbour line stops, especially if all initiatives in the Sydney's Ferry Future plan are taken into account? Currently all services on the Darling Harbour Line also stop in both directions at Milsons Point, McMahons Point and Balmain East.  

The Ferry Future plan was released by the NSW Government in May 2013. A close reading shows a significant change to the role of Balmain East wharf, currently a quiet little place with two berthings per hour on week-days in the direction of Darling Harbour and two per hour in the direction of Circular Quay. The Ferry Future vision is that it becomes an interchange for three lines - Parramatta, Woolwich and Darling Harbour.

The consequences of this, in combination with the threefold increase planned in Darling Harbour services, are enormous. As shown in the table below, Balmain East departures in the AM peak periods will increase sevenfold - from four per hour to 28 per hour. That's one ferry departure every two minutes!


Darling Harbour Line departures in 2016 based on the assumption that the Darling Line will continue to be an all stops service.  
Increased frequencies are normally welcomed by customers, but there are operational considerations peculiar to ferries which mean that 28 berthings an hour will be plain annoying.  It usually takes a minimum of two minutes for each vessel to berth, including tying and untying lines, planking the gangway and time for passenger loading.

Even with the dual berthing planned in the upgraded BaImain East Wharf, berthing conflicts in the timetable are inevitable, forcing vessels to be held off the wharf waiting for the previous ferry to depart.

There is also the impact of additional wash on the sea wall at Balmain East from the increase in vessel movements.

It is time for some re-thinking to be done on the Sydney Ferry Future plan. An increase in service frequency is a good thing, but there is a point where the network reaches overload.  Departures every two minutes is neither justified by demand nor operationally sustainable.

Monday, 15 December 2014

The New Barangaroo Ferry Terminal - First Impressions

Source: Barangaroo Delivery Authority 
Few infrastructure projects will be more critical to the Sydney Ferry network in the next 30 years than the new terminal at Barangaroo. The importance of getting it right cannot be overstated.

The terminal will replace the current King Street wharf located 200 metres south. The NSW Government's commitment to build the terminal allows some rethinking about the best way to organise the Sydney Ferry network, especially for servicing locations west of Sydney. Barangaroo, in combination with the Wynyard Walk development, provides an ideal entry point for commuters from this side of the city.

Its desirability will be further enhanced if the planned Sydney Rapid Transit line includes a stop at Barangaroo. This could provide a convenient connection between the ferry and SRT networks.  

Design details for the new terminal were released last week, accompanied by a 323 page Environmental Impact Statement and an invitation for feedback from the public. http://majorprojects.planning.nsw.gov.au/index.pl?action=view_job&job_id=6727

Initially two double faced pontoons will be constructed (four wharf faces) with the option of building a third at a later date.

A ferry terminal should allow vessels to load and unload passengers quickly and safely, enabling passengers to move effortlessly from one line to another or transfer to another mode of transport. To accomplish these objectives, there are many details to be sorted out before the design is finalised:
  • which lines will connect at the terminal?
  • how frequently will vessels stop (what will the timetable be, now and in the long term)
  • what will be the peak number of disembarkations for each arrival? What will be the peak numbers embarking?
  • how much time will transferring passengers have to move between vessels and how will this happen? 
These are just some of the details to be resolved.

If you are looking for answers to these questions, the EIS is not very illuminating. Where demand forecasts are provided, the reader is left wondering if they are credible.

Role of Barangaroo in the Ferry Network

The EIS remains true to the Sydney Ferry Futures strategy of May 2013. This means initial plans are only for two lines (Parramatta River and Darling Harbour) to stop at Barangaroo. But Sydney's development plans are moving quickly, so why not consider a line which connects Barangaroo with the Bays Precinct renewal? And why not terminate the Cockatoo Island line at Barangaroo instead of Circular Quay? This would make Barangaroo a real hub to take pressure off the congested Circular Quay.

With at least four wharf faces available at the new terminal, such an expansion could easily be accommodated. 

Demand Assumptions

Sydney has a history of transport projects with ambitious demand forecasts. This one is no exception.  Some of the forecasts include:
  • Week-day AM peak arrivals at Barangaroo to increase from the current 650 (King Street) to 3,000 in 2016. The 650 includes 150 on Darling Harbour services and 500 from the Parramatta River. Even if all the 550 River passengers who currently go to Circular Quay in the peaks suddenly elect to go to Barangaroo instead (note there is no plan to cease Circular Quay arrivals from the River), where will the other 2,000 come from? The ferry mode share of growth locations like Wentworth Point and Meadowbank has always been low and they will not contribute more than a trickle of extra passengers, even if a new wharf is built at Rhodes.
  • Ferry journeys are "estimated to grow at up to 8% per year through to 2026". Compounded over 12 years, that means ferry patronage is forecast to increase to 42 million in 2025-26, a rise of 160%, yet overall growth in all journeys to the CBD is only forecast to rise 23% in 20 years!
There are also some surprising projections for capacity growth. Week-end services are projected to increase from three to eight per hour on the Darling Harbour line and from two to six on the Parramatta River. The flow on congestion elsewhere in the network caused by such a change is hard to imagine.  Balmain East, which the Ferry Futures report nominates as an interchange for the River, Darling Harbour and Cockatoo Island lines, will resemble something like Central Station, with a conga line of boats waiting to berth.

Passenger Ingress and Egress

A blind spot in recent Sydney wharf infrastructure projects is crowd management and passenger ingress and egress. On a busy Sunday, let alone a big event, a First Fleet ferry can unload close to 400 passengers at Darling Harbour, while another 400 wait to board. 


The pontoons proposed for Barangaroo are wider than those at Circular Quay - 23 metres compared to about 18 metres at the Quay. This is welcome, but the design problems of Number 2, 4 and 5 wharves at Circular Quay are repeated in the Barangaroo plans. Despite the pontoons being wider, the waiting areas are not large enough.

The combined waiting area for the two wharf faces is about 200 square metres. This includes seating, which effectively reduces the available space. On busy days, it is quite conceivable that over 600 passengers will be waiting to board a First Fleet ferry on the north face of the pontoon and a RiverCat on the south face. It is simply unsafe, expecially with multiple strollers and some passengers in wheelchairs, to cram three people per square metre into the waiting area. The US Transportation Research Board manual on Transit Capacity and Quality of Service advises that where densities are greater than 1.5 persons per square metre in a queuing area, "long term waiting is discomforting"(1).

Many Sydney residents have experienced discomfort and fear of injury while waiting on an overcrowded pontoon at Circular Quay. This should not be allowed to happen at Barangaroo. 

Building the new terminal is also an opportunity to modernise gangway technology to speed up passenger loading and unloading. Whether this will be done at Barangaroo is not clear.  The concept design drawings show mobile ramps which look worryingly similar to the current set up. It should not be impossible to design a better vessel/ pontoon interface which allows 400 passengers to quickly disembark and 400 others to quickly board.

Summary

The Barangaroo terminal can set the agenda for the future of Sydney's urban transit ferry network. Currently released documents disappoint on a number of fronts:
  • lack of clarity about its relationship to the overall ferry network, with no acknowledgement of a possible role in serving the Bays Precinct or the existing Cockatoo Island line.
  • overly optimistic demand forecasts for the Parramatta River
  • insufficient attention to crowd management, which raises concerns about passenger safety
  • no strategy for improving the efficiency of passenger loading/ unloading.
But all is not lost, as the community consultation period has just started. Let's hope that constructive feedback will be acted on.  

Footnote
(1) Transportation Research Board: Transit Capacity and Quality of Service Manual - 2nd Edition. Part 7 Stop, Station and Terminal Capacity  http://www.trb.org/Main/Blurbs/153590.aspx 

Thursday, 4 December 2014

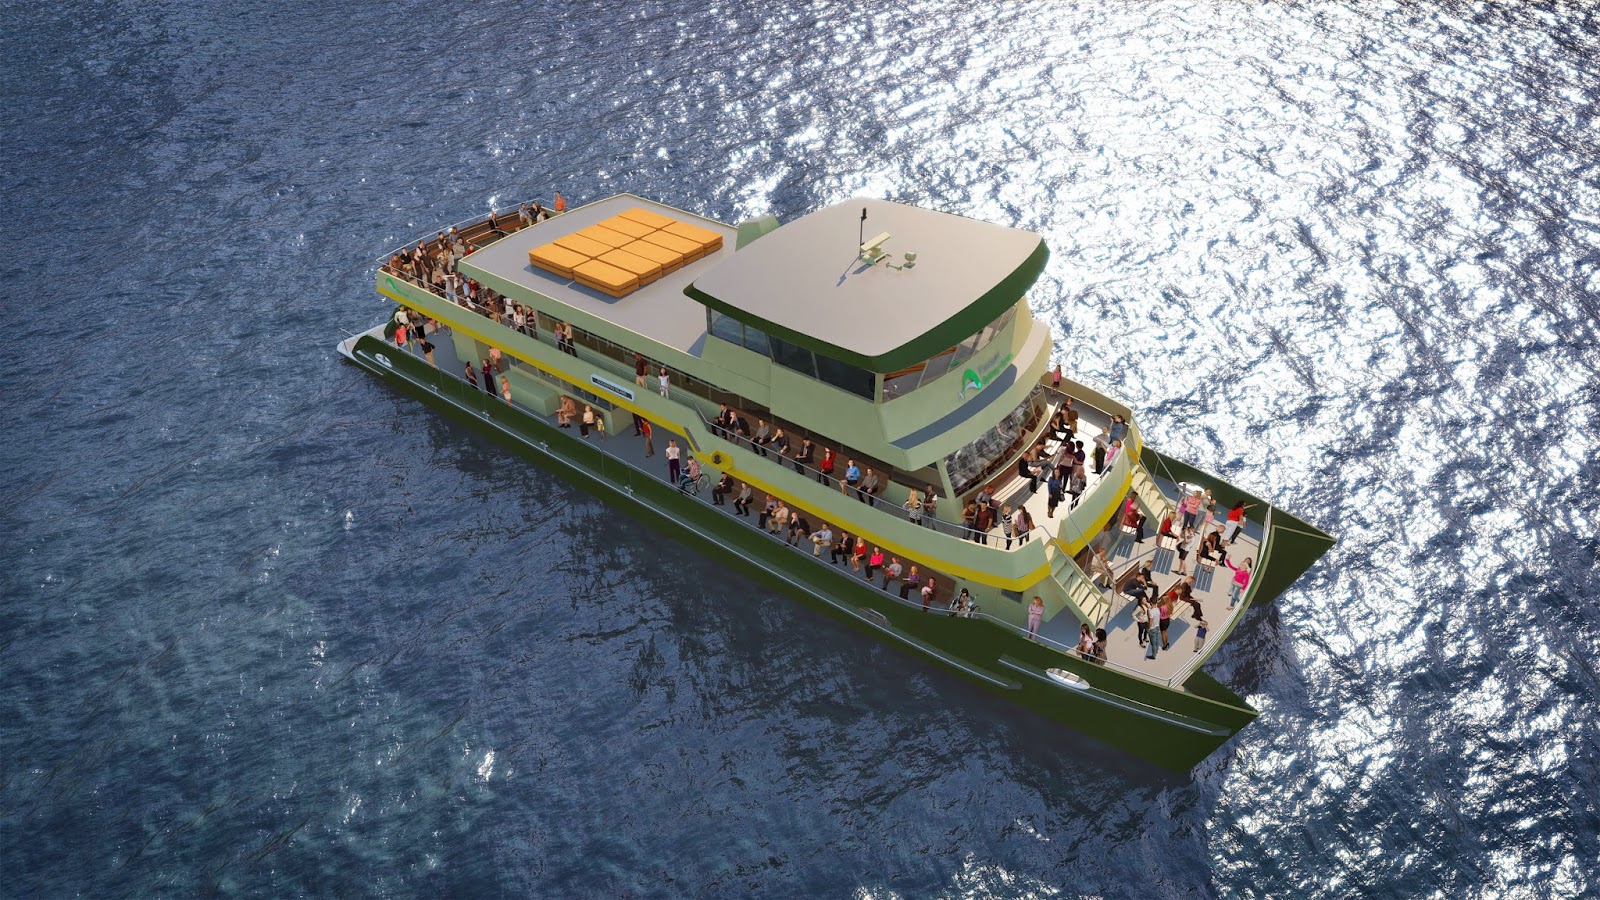
More about the new ferry fleet design for Sydney

 
There's a lot to like about the new ferry design. Perhaps it's the seductive Transport for NSW video. The author has now watched it far too many times, but then this is necessary for professional reasons to take in all the detail.

Sure, a double ended catamaran might be more practical. This would remove the need for ferries to make those dangerous reversing manoeuvres at Circular Quay or Barangaroo and reduce transit time.

And a big capacity (400 passenger) vessel is expensive to run and probably locks the ferries into a 30 minute interval network in the Inner Harbour. Smaller vessels operating at lower cost and higher frequency could create a better quality public transport system with greater ridership.

The heart, however, says the new boat is beautiful.

The original Alan Payne designed First Fleet Ferries are cute and stubby, but the lines of the new design are somehow more graceful and better proportioned. This may simply be because the original design in 1982 was cruelly shortened by the Urban Transit Authority in a failed attempt to save on crewing levels. Perhaps the upper deck of the original design had a similar spacious open area for passengers to enjoy views of Sydney Harbour.

Not sure, but whatever happened in history, the new design by the Sydney naval architect team One2Three seems to have corrected the wrongs committed more than 30 years ago.

The new design has much to admire. The seating arrangements look relaxed and spacious. As one would expect, the old First Fleeter seating, reminiscent of a Commonwealth Employment Service waiting room circa 1983, is replaced by something more comfortable, including some (but not too many) seats with tables.  Crews like the practicality of vinyl, but passengers will appreciate the comfort of new seats.


Boarding will be faster as the entry inside on the main deck is much wider and more open than the old ferry. It is hard to see a log jam of strollers posing a problem here.

Bike racks on the main deck will be a boon for cyclists. 

With a maximum operating speed of 24 knots, it has the flexibility to handle the open water runs to Rose Bay and Watsons Bay and could pick up a bit of time on the Cockatoo Island run once it heads west of Ballast Point. No doubt it has a low wash design, so recreational vessels moored in the inner harbour will not be subject to the tsunami's sometimes inflicted by the old First Fleeters.

Best of all, the open seating on the upper deck looks fantastic. There will be a stampede for the seats in front of the wheelhouse.


One word of caution: gangways. Followers of this blog will know it is an obsession of the author. Please let there be more advanced gangway technology on the new vessels to speed up embarkation and disembarkation. The animation in the video shows gangways ominously similar to the current design.

Apart from this reservation, congratulations to the One2Three team and to Minister Gladys Berejiklian for extending the life of one of Sydney's great icons.     

Wednesday, 3 December 2014

Achieving more with less in an urban ferry network

It can be hard to get your head around why a properly structured urban transit ferry network is more efficient. It's a bit like a well organised wardrobe. Neatly arranged socks and pressed shirts save space and it's easy to find whatever you want.

An integrated regular interval timetable (IRIT) is the same. With the same number of boats, a lot more can be achieved for passengers. Ridership goes up and net costs come down. It also allows space to be used more efficiently in a sometimes crowded maritime environment.  
 
The essential elements of such a network are:
  • all lines operate a strict clockface timetable. For example, departures from the local wharf, in the direction of the city, might always be 13 and 43 minutes past the hour. There may be additional departures in the peaks, but the underlying off peak pattern is retained through the peak period also.
  • stopping patterns on inbound and outbound trips are symmetrical. This means inbound and outbound trips on the same line have the same duration. 
  • connections between lines are integrated at network nodes. Optimally, vessels arrive at nodes three or four minutes before the hour and half hour and then depart three or four minutes after the hour and half hour. This means passengers can transfer between lines without inconvenience.
The benefit for passengers is obvious. Networks designed this way dramatically increase the number of convenient origin-destination (OD) pair connections. 

That some passengers need to make transfers between lines to complete a journey may be seen as a disadvantage, but as transfers are timed, and the connection holds good for all departures, it is not a major inconvenience.  


There are economic benefits in moving to an integrated regular interval timetable. This is because the significant jump in OD pair connections causes ridership to grow at a much faster rate than the operational costs.

The diagram below shows what an integrated regular interval timetable ferry network could look like in Sydney. Circular Quay is the hub for lines east of the city; Barangaroo is the hub for western lines. They are connected by the Darling Harbour line.


Features of the network are:
  • new stops at Rhodes and Elizabeth Bay
  • a new line for the Bays Precinct, with stops at Jacksons Landing, Rozelle and Glebe Point
  • span of service for Watsons Bay extended to include AM and PM peaks (30 minute headways)
  • timed transfers at Barangaroo and Circular Quay on the hour and half hour.
  • Balmain East is a partial node, which means passengers on the Cockatoo Island Line can transfer here for departures to and from Circular Quay, or continue on to Barangaroo.
  • timed transfers at Cockatoo Island, so passengers on the Cockatoo Island Line can connect conveniently with Parramatta River services.    
The network takes advantage of improved access to the Sydney CBD from its western edge as a result of the Wynyard Walk and Barangaroo developments. It also neatly links the proposed Bays Precinct renewal to the entire ferry network.

Overall, convenient origin-destination pair connections increase more than fourfold, from 96 to 404.

One might expect that such an improvement in customer outcomes would be more costly, with additional vessels and increased taxpayer subsidy. No, it reduces net costs to taxpayers.

The following table compares the existing Sydney Ferry network with the integrated regular interval timetable network proposed in this post:

Current ferry operator payments and revenue sourced from Auditor General's Report Vol 7, November 2014  


It is hard to predict the ridership impact of a fourfold increase in convenient OD pair connections - it is conservatively estimated here to be 40%. While there is an 12% increase in service hours, the extra costs in operator payments are more than offset by the extra revenue from ridership growth. 

The peak fleet requirements are unchanged because of the efficiencies inherent in an IRIT network. Operating costs per service hour are also reduced as labour costs will be less.    

The economic benefits don't end with reduced subsidies to the ferry operator. An IRIT network also means it is easier to share waterways with other users, such as cruise ships.

Sydneysiders are familiar with the impact of a large cruise ship berthing in Sydney Cove. It is disruptive for all vessel movements in the harbour.

If all lines in the ferry network are scheduled to arrive and depart Circular Quay around the hour and half hour, there are two 10 minute slots free every hour when no ferries are entering or departing Sydney Cove. This means a crowded maritime space can be safely shared for the economic benefit of Sydney.

For those who like details, the following table provides more information on what each line could look like in a Sydney ferry network based on IRIT principles.